
Get a personalized demo of Stuut and see how it can help with AR automation.
The difference between "roughly 52 days" and "precisely 52.3 days using average AR and net credit sales" separates board presentations that invite questions from those that command confidence.
This guide covers the exact mechanics of DSO calculation, including when to use ending AR versus average AR, why credit sales matter more than total revenue, and how the Countback Method handles seasonal fluctuations that the standard formula misses. You will also see how moving from calculating the number to actively reducing it can free millions in working capital.
Days Sales Outstanding represents the average number of days it takes to convert credit sales into cash. According to the Corporate Finance Institute, DSO is a working capital metric that measures how efficiently a company collects cash from credit purchases, and it matters for three reasons:
Cash flow predictability: A lower DSO means more cash on hand, while a higher DSO indicates slower credit sales to cash conversion that leads to low liquidity and cash flow generation.
Audit readiness: DSO trends appear in board materials and external audit documentation, so a consistent calculation methodology prevents variance explanations from consuming your time.
Working capital optimization: Every day of DSO represents cash sitting in accounts receivable instead of funding operations, inventory purchases, or debt reduction.
DSO helps management optimize cash flow and manage liquidity risk by providing insights into operating efficiency.
The formula is straightforward: DSO = (Accounts Receivable ÷ Net Credit Sales) × Number of Days
Salesforce describes the result as the average number of days it takes for your business to collect payment after a sale. Getting the inputs right, however, requires precision on each component.
The denominator must include only credit sales, not cash sales or total revenue. Cash sales are not included because they represent a zero DSO, meaning no time waiting from sale date to receipt of cash.
Here is how to identify credit sales:
Start with total revenue from your income statement
Subtract cash sales (point-of-sale transactions, prepaid orders, immediate payment receipts)
Subtract returns and allowances to arrive at net credit sales
For example, if a company reported $2.5 million in sales revenue with $1.5 million in credit sales and $1 million in cash sales, only the $1.5 million credit sales figure enters the formula.
Common mistake: If you use gross sales or total revenue, you artificially inflate the denominator and lower your DSO. This creates a misleading picture that will surface during audit review or when you compare against industry benchmarks.
The numerator represents the receivables balance used in your calculation, and you have two options:
Wall Street Prep notes that using the average balance prevents a timing mismatch between the numerator and denominator. The more common approach is to use the ending balance for simplicity, as the difference in methodology rarely has a material impact on balance sheet forecasting.
Practical example: If your beginning-of-quarter AR is $75,000 and ending AR is $25,000, your average AR is $50,000: ($75,000 + $25,000) ÷ 2 = $50,000.
For real-time payment reconciliation, using average AR provides a more stable metric that smooths out end-of-period fluctuations.
The "Number of Days" varies based on your measurement period (365 for annual, 90 for quarterly, 30 for monthly). Wall Street Oasis explains that 365 is the most commonly used convention, though some analysts prefer 360 days because the 30/360 method was originally devised for hand calculation and assumes every month has 30 days.
Worked example (annual calculation):
This means the company takes an average of 45.6 days to collect payment after a credit sale.
Even experienced finance teams make these errors:
Using total revenue instead of credit sales: This inflates the denominator and artificially lowers DSO
Mixing 360/365 day conventions: Use the same convention across all periods for accurate trend analysis
Forgetting to adjust for returns and allowances: Net credit sales should exclude credits issued
Using beginning AR versus ending AR inconsistently: Pick one method and apply it consistently across all periods
Consider a manufacturing company with the following figures:
Step-by-step calculation:
Calculate average AR: ($2,400,000 + $2,800,000) ÷ 2 = $2,600,000
Apply the formula: ($2,600,000 ÷ $18,000,000) × 365 = 52.7 days
The company collects receivables in approximately 53 days on average, which falls within the 45 to 60 day benchmark typical for manufacturing companies.
For companies that need more frequent visibility into collection trends, quarterly calculations provide faster feedback. To calculate quarterly DSO, adjust the days in period to 90:
Calculation:
Average AR: ($850,000 + $1,100,000) ÷ 2 = $975,000
DSO: ($975,000 ÷ $3,200,000) × 90 = 27.4 days
Quarterly DSO provides more immediate feedback on collection efficiency and helps identify trends before they compound into annual variances. Companies that track DSO monthly or quarterly gain timely insights into accounts receivable performance and can adjust collection strategies proactively.
The standard formula has a limitation: it assumes even revenue distribution throughout the period. For businesses with seasonal sales patterns, this assumption creates distortion, and the Countback Method solves this problem.
According to Upflow's DSO guide, the Countback Method is more complex but more accurate because you go back month by month to find exactly how long it took to get paid. You need both your receivable balance and gross sales amount from each month.
Starting point: Your ending AR balance for the period you want to measure.
The logic: Subtract each month's sales from your AR balance, moving backward in time, until you exhaust the receivables balance.
Consider a company with $212,000 in ending AR and the following monthly sales:
Walkthrough:
Month 3 coverage: Subtract Month 3 sales ($100,000) from AR ($212,000). Remaining: $112,000. Month 3 is fully covered, so add 30 days.
Month 2 coverage: Subtract Month 2 sales ($80,000) from remaining AR ($112,000). Remaining: $32,000. Month 2 is fully covered, so add 30 days.
Month 1 contribution: Remaining AR is $32,000 while Month 1 sales are $70,000. Since sales exceed remaining AR, calculate the fraction: $32,000 ÷ $70,000 = 0.457. Days from Month 1 included in DSO: 0.457 × 30 = 13.7 days.
Total DSO: 30 + 30 + 13.7 = 73.7 days
The Countback Method is particularly valuable when revenue fluctuates significantly between months. A company with $500,000 in December sales and $100,000 in January sales would see dramatically different standard formula results depending on when you calculate, while the Countback Method reflects actual collection timing.
DSO benchmarks vary significantly by industry because payment terms, customer mix, and business models differ. According to Upflow's State of B2B Payments report, the overall median DSO across industries is 56 days.
Industry benchmarks for 2025 show that manufacturing typically ranges from 45 to 60 days, while retail and e-commerce show very low DSO benchmarks because most sales use cash, credit card, or digital payment methods.
Healthcare carries unique challenges. The average DSO for healthcare over the last four years was 47 days, with DSO remaining constant at 45 days in 2021 and 2022.
Interpretation guidance:
Lower than benchmark: Strong collection efficiency and healthy cash flow
At benchmark: Operating within industry norms
Higher than benchmark: Potential issues with credit policy, collection process, or customer payment behavior
For a deeper understanding of what DSO means in accounts receivable and how it connects to overall financial health, the calculation alone tells only part of the story.
Calculating DSO accurately diagnoses the problem, but reducing DSO requires changing operational processes. The challenge for most AR teams is coverage: you cannot contact every customer, follow up on every aging invoice, and match every payment manually without adding staff.
Most AR teams prioritize large outstanding balances, which leaves smaller accounts unworked until they age past 60 or 90 days. By then, collection probability drops significantly.
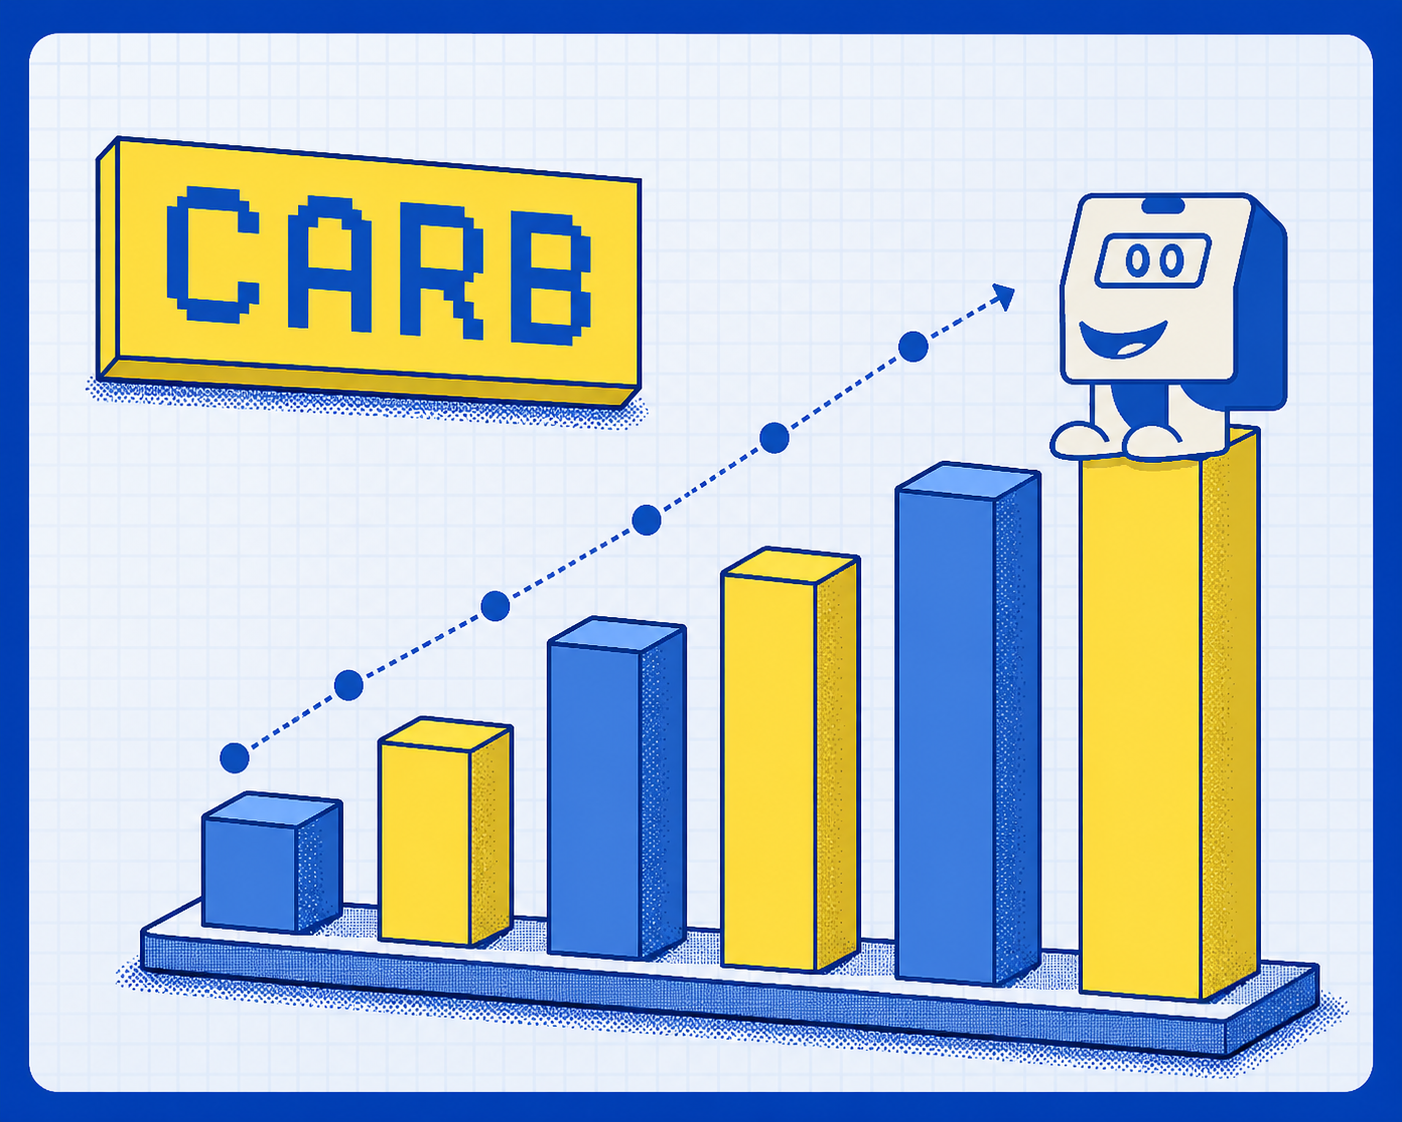
We contact customers before invoices become overdue and maintain consistent follow-up without manual effort. Our customers see a 37% faster DSO because our AI handles the volume while humans manage relationships that require judgment.
We extend coverage to the full portfolio. Our AI-powered AR platform handles routine outreach while your specialists focus on complex disputes and strategic accounts, making your team unstoppable without adding headcount.
Manual cash application creates "artificial DSO" when payments arrive but remain unposted. Money sits in the bank, but your AR balance shows it as uncollected because manual matching has not occurred, and this backlog typically compounds during month-end close.
We eliminate this bottleneck by matching payments to invoices as they arrive in real time. The result is accurate AR aging reports throughout the month, not just after a close-period scramble.
Improving cash application rates depends heavily on remittance data quality. We learn remittance patterns and handle partial payments, short-pays, and bulk payments without manual intervention because real-time payment reconciliation eliminates the backlog that inflates DSO.
Disputes that linger in aging buckets inflate DSO. A customer who owes $100,000 but disputes $5,000 may withhold the entire payment pending resolution. When you resolve disputes faster, you reduce the invoice from 60 days overdue to current.
Bishop Lifting proved this principle by reducing overdue receivables by 35% and achieving 2-minute response time to customer inquiries because we provided instant context on every account. For companies managing AP portal complexity, streamlining the invoice submission and validation process prevents disputes before they occur.
Accurate DSO calculation gives you the diagnostic, but reducing the number requires execution. You need to contact customers before invoices age, match payments in real time, and resolve disputes faster than manual processes allow.
We deliver 40% cash flow increases and 37% faster DSO by automating the repetitive work that traps cash in accounts receivable. Customers including Bishop Lifting, Honeywell, and PerkinElmer have seen these results with 3-4 day implementations.
Book a demo to see how we calculate DSO in real time and, more importantly, how we reduce the metric by executing collections autonomously.
DSO measures how many days you take to collect cash from customers, while Days Payable Outstanding (DPO) measures how many days you take to pay suppliers. Both are components of the cash conversion cycle and work in opposite directions for your working capital.
DSO cannot be negative because it measures days after a sale. If your calculation shows negative DSO, check for data entry errors in AR or credit sales figures.
DSO is typically calculated monthly or quarterly to provide timely insights into AR performance. Monthly calculations allow faster course correction, while quarterly figures align with board reporting cycles and external stakeholder communication.
Both 365 and 360 are acceptable, though 365 is most common in modern practice while some industries and financial models use 360 for calculation simplicity. Consistency matters more than the specific choice, so use the same convention across all periods for accurate trend analysis.
Use the Countback Method when revenue fluctuates significantly between periods. The standard formula assumes even distribution, which distorts results for seasonal businesses or companies with lumpy revenue recognition.
Credit sales: Revenue from transactions where payment is not received immediately. Cash and prepaid sales are excluded from DSO calculations because they represent zero days to collect.
Aging buckets: Categories for organizing receivables by how long they have been outstanding. Standard buckets include current (0-30 days), 31-60 days, 61-90 days, and 90+ days past due.
Bad debt: Receivables that become uncollectible and require write-off as an expense. High bad debt ratios suggest weak credit policies or collection processes.
Cash application: The process of matching incoming payments to open invoices and posting entries to the AR subledger. When you delay cash application, you artificially inflate DSO because payments remain unrecorded in your AR aging.
Collection Effectiveness Index (CEI): A complementary metric to DSO that measures the percentage of receivables collected within a given period. CEI provides additional context on collection performance that DSO alone does not capture.