.png)
Get a personalized demo of Stuut and see how it can help with AR automation.
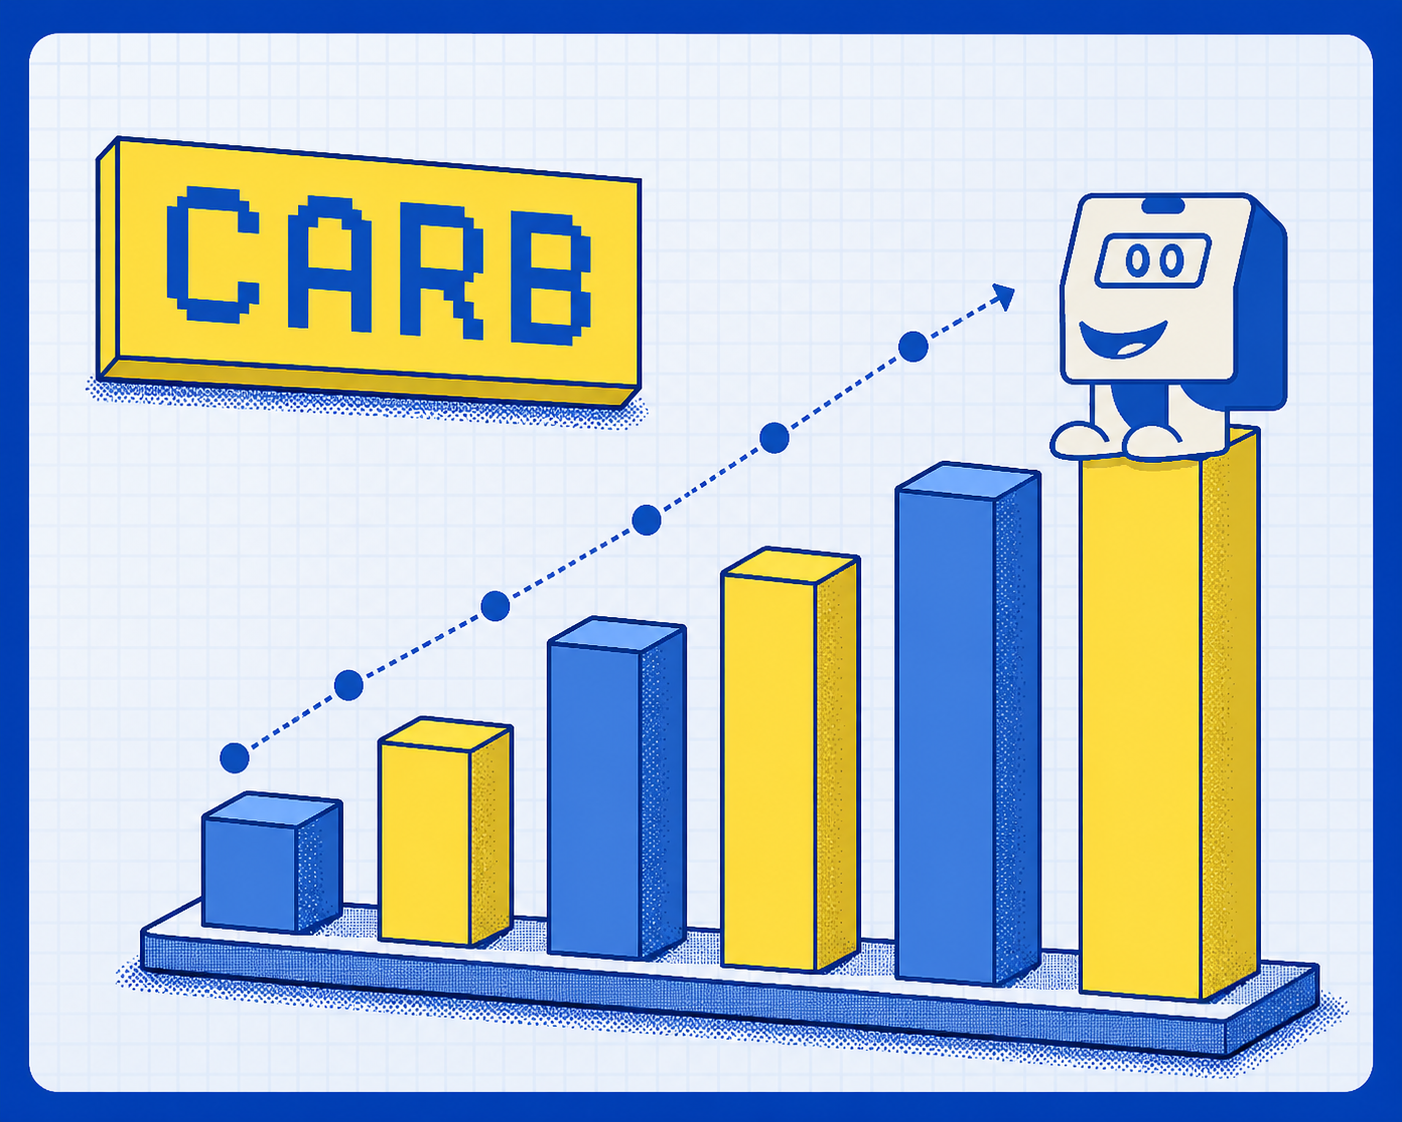
Most finance teams obsess over raw DSO numbers while ignoring the underlying payment terms and manual bottlenecks that actually trap cash in receivables. When management sees DSO creeping past 60 days, the typical response is to push harder: more calls, faster follow-ups, greater pressure on the team. That reaction skips the real problem. Your AR team is spending the majority of each day on repetitive tasks that anyone could do while the accounts that need attention sit untouched.
Finance teams watch Days Sales Outstanding (DSO) more closely than any other AR metric, yet most misunderstand what it actually measures. Stripped of context like payment terms, industry benchmarks, and the Collection Effectiveness Index (CEI), a raw DSO number drives AR teams to chase the wrong priorities. This article breaks down the facts behind the most common DSO myths so you can defend your team and actually move the needle on cash flow.
DSO stands for Days Sales Outstanding and generally represents the average number of days your company takes to collect payment after completing a credit sale.
The standard DSO formula is:
DSO is calculated as: (Accounts Receivable / Total Credit Sales) x Number of Days in Period
Here's how to calculate it:
That 55-day result means it takes roughly 55 days on average to collect payment. Whether 55 days represents strong or weak performance depends entirely on your payment terms and industry benchmark, which is exactly where the myths begin.
Your aging report is built on the same logic as DSO. Every morning, you sort invoices by how many days they've been outstanding and prioritize which accounts to contact. A rising DSO signals that more invoices are sitting in the 31-60 and 61-90+ buckets instead of clearing at or near terms, but the raw number rarely tells you why, and that's the critical distinction management often misses.
Myth: A low DSO means your collections team is performing well.
Fact: A low DSO can be a warning sign, not a badge of honor.
An unusually low DSO relative to your payment terms may indicate that your team is collecting efficiently, but it's worth examining whether your credit policies align with your growth objectives. The right DSO isn't the lowest possible number. It's the number that balances cash flow with the credit terms needed to win and keep customers.
Collecting in 40 days is either excellent or terrible depending entirely on your terms. A 40-day DSO on Net 15 terms suggests collections are lagging significantly, while the same 40-day DSO on Net 60 terms indicates collections are running ahead of the due date. Payment terms play a significant role in what counts as a good DSO: a company on Net 30 terms should generally target closer to 30 days, while a company on Net 60 terms with a 55-day DSO would be performing well relative to its terms. You can't compare raw DSO numbers across companies without knowing their terms.
Industry context changes everything. Different sectors naturally have different collection cycles. Comparing your DSO to your own industry peers provides more meaningful context than comparing across all businesses. Seasonality matters too: some businesses experience DSO fluctuations tied to their customers' buying and payment cycles. Trend lines over 12 months tell a more accurate story than any individual monthly data point.
Myth: DSO is the only metric you need to evaluate collection performance.
Fact: DSO tells you how long collection takes on average, not how effectively your team collects what's available to collect.
The Collection Effectiveness Index (CEI) is used to measure the percentage of receivables your team actually recovered from everything available for collection during a period. Unlike DSO, CEI is designed to reflect your team's actual performance rather than the average speed of payment.
CEI formula:
CEI is commonly calculated as: ((Beginning Receivables + Credit Sales - Ending Total Receivables) / (Beginning Receivables + Credit Sales - Ending Current Receivables)) x 100
The numerator shows what you actually collected: beginning receivables plus new credit sales, minus all outstanding receivables at period end. The denominator shows what was available to collect: the same components, but subtracting only current receivables that aren't yet due. This ratio reveals true collection efficiency because it measures recovery against what could have been collected, not including invoices still within terms.
How to interpret your CEI:
Here's why this matters in practice: your DSO could hold steady while CEI drops, meaning you're collecting slower on everything available, not just dealing with a few problem accounts. DSO and CEI can tell opposite stories about the same portfolio, which is why relying on one alone misleads management. For a practical framework combining both metrics, our DSO improvement checklist covers the step-by-step process.
Table 1: What DSO and CEI measure
Table 2: When to use DSO vs. CEI
Watch what happens inside your aging report, not just the overall DSO number. If your 0-30 bucket is shrinking while your 90+ bucket grows, DSO might still look acceptable while a serious problem develops. Movement from current to 31-60 to 61-90 is the early warning system that aggregate DSO consistently masks.
Myth: High DSO means the collections team needs to work harder.
Fact: High DSO often reflects a mismatch between the payment terms in your ERP and what sales actually negotiated.
When DSO appears high relative to standard payment terms, the issue may reflect a mismatch between the payment terms in your ERP and what sales actually negotiated. For example, if the ERP shows Net 30 while sales actually negotiated Net 45 with a key account, the problem is a data mismatch, not a performance failure. Your team looks like it's failing when it isn't, and that ERP configuration error needs to be fixed before your next management review.
Before restructuring payment terms, check whether proactive outreach is already in place. Contacting customers before invoices go overdue to confirm receipt and payment timing often prevents clerical delays from pushing invoices past due. Many overdue invoices stem from common issues like a wrong email address, a missing purchase order number, or an invoice routed to the wrong department. Reaching out early catches these before they age.
Myth: Improving DSO requires hiring more AR staff to cover more accounts.
Fact: Most DSO improvement comes from reaching accounts your team is already ignoring because there's no time, and AI covers those without adding headcount.
The manual workflow bottleneck is real and measurable. You export aging reports to Excel, sort and filter by hand, log into Ariba or Coupa to submit invoices, spend hours on collection calls that often end in voicemail, and respond to inbound questions one by one while the long tail of smaller accounts gets ignored entirely because there's no time left after working through your largest customers. Those untouched accounts age from 30 to 60 to 90+ days while you're occupied elsewhere, and DSO climbs as a result.
Traditional AR software gives you email templates and task reminders, but your team still logs in, still matches payments, and still submits invoices to portals. Autonomous execution means the AI completes those workflows independently. Stuut's AI agent contacts customers before invoices go overdue, follows up across email, SMS, and voice, and matches incoming payments by learning remittance patterns, handling partial payments and short-pays, and flagging exceptions when confidence drops. This produces a 95%+ automated match rate, posting entries to your ERP in real time. It covers the long-tail accounts you never have time to reach while you focus on complex disputes, payment plans, and the customer relationships that need human judgment.
PerkinElmer reduced overdue invoices from 50% to 15% in one year and collected $300M. Bishop Lifting reduced overdue receivables by 35% across 45 branches and unlocked $3M in working capital. That outcome comes from covering accounts that previously went untouched, not from asking the existing team to work faster.
Razvan Bratu, Head of Quote to Cash at Honeywell, described the operational shift directly:
"We're collecting faster from the in-scope customers, our cash flow is improving, and our team has more time to focus on white gloves service for top customers. The platform handles the routine work so our people drive increased real business value." - Razvan Bratu, Honeywell
Myth: There's a universal "good" DSO number every company should aim for.
Fact: DSO benchmarks vary significantly by industry, company size, and customer mix, and comparing across these dimensions without context produces misleading conclusions.
Sector-specific norms differ substantially, and hitting a benchmark from the wrong industry can push your team toward the wrong targets. DSO benchmarks vary by sector:
A manufacturer with 52-day DSO is operating within normal range. The same number at a SaaS company signals a significant collection problem.
Enterprise buyers like large retailers or major industrial distributors often impose their own payment terms on suppliers regardless of what your invoice says. If a major customer dictates Net 60 as a condition of doing business, your DSO will reflect that reality. A single large account paying on extended terms can skew your overall number materially, which is why management needs to understand that DSO reflects your customer mix as much as it reflects your team's collection performance.
Using DSO correctly means treating it as one signal among several, not the only verdict on your AR team's performance.
Best Possible DSO (BPDSO) closes the gap between raw DSO and realistic expectations. BPDSO is defined as the best-case receivables level assuming no delinquency occurs, using only current receivables in the numerator:
BPDSO is calculated as: (Current Receivables x Days in Period) / Credit Sales for Period
Subtract BPDSO from your standard DSO to calculate Average Days Delinquent (ADD). A company with 45.5-day DSO and 17-day BPDSO has 28.5 average days delinquent. That 28.5-day gap is the actual collection problem to address, not the raw 45.5 number.
Combine three signals for a complete performance picture: DSO against BPDSO (how much delinquency exists), CEI (how effectively you're collecting what's available), and aging bucket distribution (where the risk is concentrated). These three together give you a defensible narrative when management asks why DSO looks the way it does and point to specific actions rather than generic pressure to call more accounts.
Understanding DSO correctly matters less than avoiding the management mistakes that follow from misreading it.
DSO improvement doesn't happen immediately, even with the right tools. Stuut connects to your ERP via API in 3 to 4 days without modifying your existing configuration, with full go-live typically reached within 6 to 10 days for standard environments, but meaningful results still take time to appear. Teams that deploy autonomous collections coverage see measurable movement within 60 to 90 days, according to Stuut's DSO Improvement Checklist. This timeline accounts for the weeks needed to build contact history and payment pattern data before payment behavior shifts. Setting realistic expectations with your AR Director upfront prevents pressure to show results before the system has had time to influence customer payment timing.
Unresolved deductions and disputes can delay cash flow as disputed invoices sit in limbo while your team researches short-pays. Stuut's handles routine deductions and routes exceptions through your existing workflow, which removes the manual investigation bottleneck on the most repetitive cases. The system's approach to deduction handling aims to prevent valid amounts from being overlooked during the resolution process.
Manual portal work can slow down invoice processing when customers require portal submission before starting their payment cycle. Some manufacturing and distribution companies report delays of days or weeks between generating an invoice and having it appear in a customer's AP system. While Stuut connects to major ERPs like SAP, Oracle, NetSuite, and Dynamics, the extent to which it handles customer portal submissions varies by portal type and customer configuration.
Managing DSO well requires accurate measurement, industry-appropriate benchmarks, and the capacity to reach your full account portfolio. Stuut customers report an average 37% reduction in past-due AR by autonomously handling the routine outreach and payment matching that currently consumes most of your team's day. Book a demo to see autonomous collections in action.
DSO (Days Sales Outstanding) is the average number of days a company takes to collect payment after making a credit sale, calculated as (Accounts Receivable / Total Credit Sales) x Number of Days in Period. A company with $30,000 in AR and $200,000 in annual credit sales carries a DSO of approximately 55 days.
A good DSO for manufacturing often falls around 45 to 60 days, but the right target depends on your product mix, customer concentration, contract structure, and payment terms. A 52-day DSO may be normal for a manufacturer selling to large enterprise buyers on extended terms, while the same number could signal a collection problem in a faster-paying sector.
DSO measures how many days collection takes on average, while the Collection Effectiveness Index measures what percentage of available receivables were actually collected during a period, where 80%+ is considered good and 90%+ is excellent. Your DSO can stay flat while CEI drops, revealing different aspects of collection performance.
BPDSO = (Current Receivables x Days in Period) / Credit Sales for Period, using only current receivables (not overdue) in the numerator. Subtract BPDSO from your standard DSO to calculate Average Days Delinquent, which is the specific collection gap your team needs to close.
Days Sales Outstanding (DSO): The average number of days between completing a credit sale and receiving payment, calculated as (AR / Credit Sales) x Days in Period.
Collection Effectiveness Index (CEI): A percentage measuring what portion of available receivables were collected in a given period. Scores above 80% are considered good; above 90% is excellent.
Best Possible DSO (BPDSO): DSO calculated using only current receivables, representing the ideal collection timeline assuming no invoices are overdue.
Average Days Delinquent (ADD): Standard DSO minus BPDSO, measuring the actual delinquency gap in your AR portfolio and the real target for improvement.
Cash application: The process of matching incoming payments to open invoices and posting the entry to the AR subledger in your ERP.
Short-pay: When a customer pays less than the invoiced amount, due to a deduction, dispute, or early-pay discount claim.
Aging buckets: Categories that group outstanding invoices by how many days they have been outstanding.
Dunning: Systematic, often automated communication sent to customers to collect on overdue invoices, typically delivered via email, SMS, or phone.